Changing of Allele Frequencies
by Haley DeLeon
Period 1
AP Bio
In our lab investigation we will be trying out different starting allele frequencies in our model. Therefore we will be changing the allele frequencies and seeing what the results are. If the allele frequencies change when the p value decreases and the q value increases then the frequencies will start to increase then they will decrease dramatically.
Materials Needed to Conduct Lab:
1. Lab Sheet
2. google spreadsheet
3. calculator
4. hardy weinberg equation
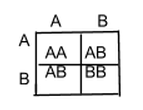
5. punnett square
Procedures:
1. We need to build a lab spreadsheet that will model how allele frequencies change through one life cycle of this imaginary population.
How to make a lab spreadsheet:
(1. In Google Drive open a spreadsheet.
2. Name the document H-W lab F. Last Name
3. In Square A2 type p =. In Square B2 the frequency of. In Square C2 type A. In Square D2 type =0.6.
4. In Square A3 type q =. In Square B3 type frequency of. In Square C3 type B.
5. In Square D3 type the following formula =SUM(1 - D2).
6. Merge cells E4 and F4 and type gametes. Type Zygotes in cell G4
7. In Square E5 type ==IF(RAND()<=D$2,"A","B")
8. In Square F5 type = IF (RAND () <= D$3, "A", "B")
9. Click on the square until it becomes outlined in blue. Drag the blue square in the bottom right corner down for 16 squares in column E. Repeat the same for column F.
10. In Square G5 type =CONCAT(E5,F5). Click on the square until it becomes outlined in blue. Drag the blue square in the bottom right corner down for 16 squares.
11. In Square H4 type AA, I4 AB, and J4 BB.
12. In Square H5 type =IF(G5=”AA”, 1, 0), Square J4 =IF(G5=”BB”, 1,0). Drag down the formula 16 squares.
13. In Square I5 type =IF(G5="AB",1,(IF(G5="BA",1,0)))
13. In Square G25 type Total, In H25, I25, and J25 write a SUM function to total all of you AA, AB or BA, or BB combinations by typing =SUM(H5:H25), =SUM(I5:I25), =SUM(J5:J25).
14. In F27 type Number of each allele. In H27 type =SUM((H24*2),I24) and in I27 type =SUM((J24*2),I24). Type in H28 A and in H29 B.
15. Create a bar graph with your data.)
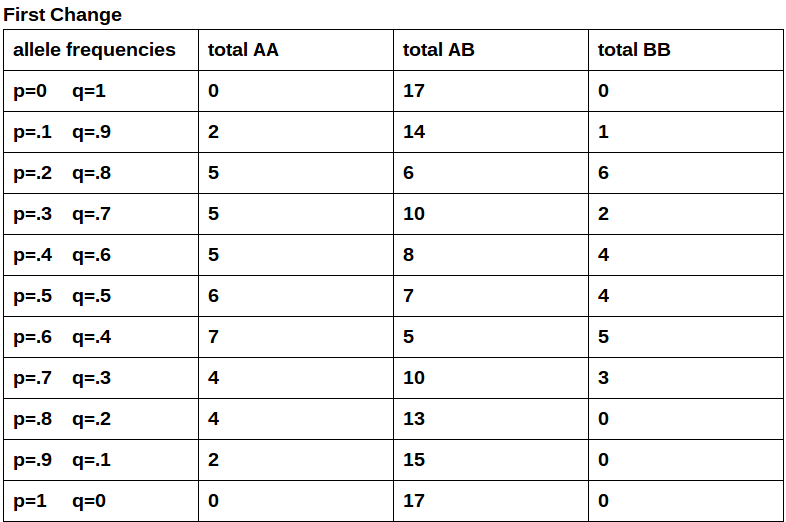
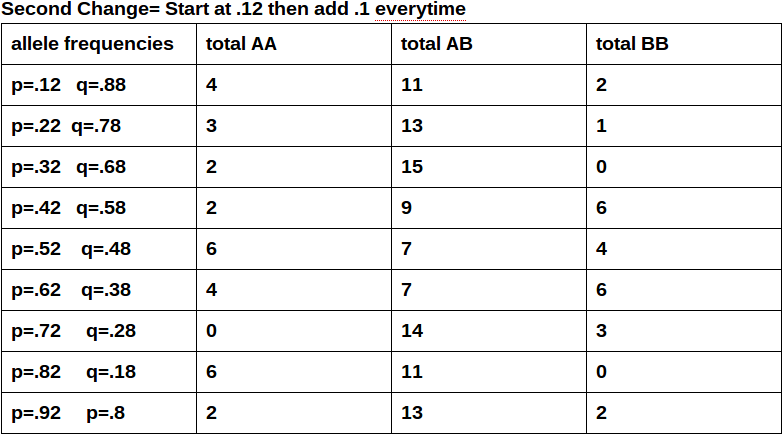
2. Make two separate tables that have 4 columns and 13 rows each. In the first column name it (allele frequencies). In the second column name it (total AA). In the third column name it (total AB). In the fourth column name it (total BB).
3.Now you are going to change the allele frequencies by changing p and q to the numbers that are listed in the first column below.
4. Then jot down the totals for AA, AB, BB. Then go on to your second change and do the same as step 3.
5.These tables represent the allele frequency changes in a population. You are going to use this spreadsheet and tables to help you answer the questions I answered. Hopefully my data helps.
How do inheritance patterns or allele frequencies change in a population over time?
They change in populations over time because they are the features that allow the animals to adapt to their environment. When their environment changes the animals have to change to live and be able to reproduce in the environment that they live in.
Guiding questions:
What can you change in your model?
I can change the allele frequencies so that the totals will vary.
If you change something in your model, what does the change tell you about how alleles behave?
If I change something in my model then the totals will react to the change. It is like a population. When your environment gets changed then you have to adapt and change to fit to your environment . That is how the alleles are acting. Changing to fit in their new environment.
Do alleles behave the same way if you make a particular variable more extreme? Less extreme?
No they don't behave the same way if you make a particular variable more extreme than less extreme. When the alleles are more extreme the dominant allele is higher than the low. Same with the recessive allele when it is high the dominant allele is lower.
- Create a Punnett square for a graphical approach.
- Do alleles behave the same way no matter what the population size is? To answer this question you can insert rows of data .
- Assessment of your investigation: Create a formula that predicts the genotypes of the next generation.
- p^2+2pq+q^2=1
- Predict genotypes for the next generation using the H-W equation.
.12+2(.1)(.9)+.92=.01+.18+.81=1
- Answer the following questions with your formula
- In the absence of random events (an infinitely large population), are the allele frequencies of the original population expected to change from generation to generation?
Yes the allele frequencies of the original population are expected to change from generation to generation due to hardy weinberg's equilibrium. - How does this compare to a population that has random gamete selection but is small?
It is different because a large population is has many opportunities for evolution to happen and genetic drift to happen. A small population isn't big enough for those things to happen.There aren't a lot of the same species for that to happen. - What happens to allele frequencies in such a population? Is it predictable?
Since the population isn't diverse the population can't expand and there isn't much for it to do by adapting to the environment because the specie will tend to die off because there aren't enough of the same species to reproduce. - What factors can cause allele frequencies to change in a population? (There are many)
Genetic Drift, Gene Flow, Mutations, Nonrandom mating, and Natural Selection can all cause the allele frequencies to change in a population. - How could you model these factors using your spreadsheet?
- Try out different starting alleles frequencies in the model
- Describe the patterns that you find. Develop and use a pattern to select your values and to test and organize your exploration. Test extreme and intermediate values.
Conclusion: Discussion of Results/Errors:
Overall in this experiment I changed the allele frequencies and saw what each generation would look like. I saw if there was a change in the totals of the different individuals. I accomplished successfully writing my first lab write up and starting from scratch. I conducted a thorough experiment of how allele frequencies change over time in populations. I know understand biology to a greater extent. I now see how populations evolve and change over time. Some errors that occurred were during making my graphs and at the beginning with making the spreadsheets. I would say triple check when you are done making your spreadsheets to make sure you made it correctly. But other than these few mistakes my lab was fortunately successful. The hypothesis was proved incorrect. The frequencies didn't decrease dramatically. They either were leading into increase or they were either leading to a decrease. They didn't increase then decrease dramatically. They responded with a decrease then an increase or it was just a complete decrease.
Overall in this experiment I changed the allele frequencies and saw what each generation would look like. I saw if there was a change in the totals of the different individuals. I accomplished successfully writing my first lab write up and starting from scratch. I conducted a thorough experiment of how allele frequencies change over time in populations. I know understand biology to a greater extent. I now see how populations evolve and change over time. Some errors that occurred were during making my graphs and at the beginning with making the spreadsheets. I would say triple check when you are done making your spreadsheets to make sure you made it correctly. But other than these few mistakes my lab was fortunately successful. The hypothesis was proved incorrect. The frequencies didn't decrease dramatically. They either were leading into increase or they were either leading to a decrease. They didn't increase then decrease dramatically. They responded with a decrease then an increase or it was just a complete decrease.
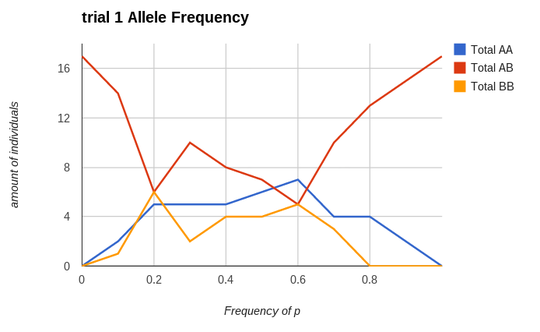
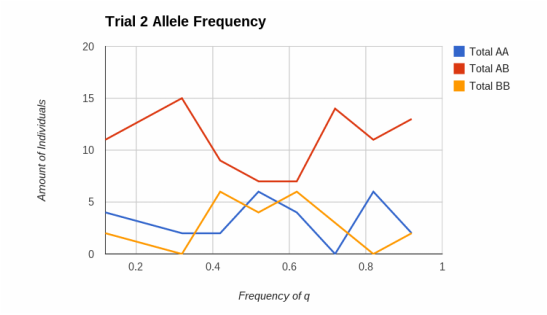
Graph Justification:
I used a line graph for my data to compare changes over time. In the experiment the y values are always described as the amount of individuals over time. It always then has the x value as the frequency of either p or q that responds to the amount of individuals.
I used a line graph for my data to compare changes over time. In the experiment the y values are always described as the amount of individuals over time. It always then has the x value as the frequency of either p or q that responds to the amount of individuals.
 RSS Feed
