What the Lab Consists of:
Activities 10A-10C:
Activity 10A: Measuring Blood Pressure
This activity illustrates the various components used to assess cardiovascular fitness, including pulse rate, blood pressure, endurance and the baroreceptor reflex.
Hypothesis:
If you take the blood pressure of the subject three times then the subjects first reading of their blood pressure will be the highest. When conducting the experiment we are:
Materials:
Steps in Conducting Activity 10A:
5. 1. inflate the sphygmomanometer cuff by pumping until it reads at least 200 mm Hg.
2. The open valve on sphygmomanometer slightly so the air from the cuff escapes slowly.
3.Recorder should then listen carefully watching the pressure gauge to determine the pressure where the sound of a Korotkoff are first noticed-Systolic Pressure.
6. Continue to release pressure from cuff slowly and pay attention to gauge, once you hear the heart sound stop this is the diastolic pressure.
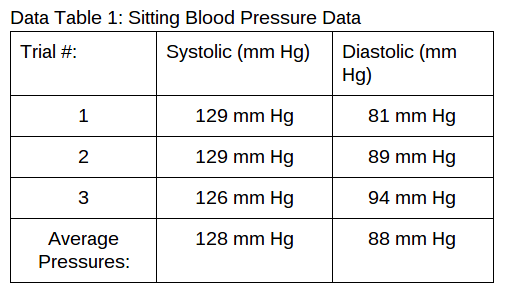
7. The recorder should then release the rest of the air and take off the cuff of the test subject and record the systolic and diastolic pressure and record them in data table 1.
8. Take 2 more readings of the subject and record them in Data Table 1.
9. Repeat for other lab partners so you have gotten 3 readings for each person.
Conclusion: Since we had to take the blood pressure of the subject 3 times the blood pressure did go down. The first reading of the blood pressure was the highest then it started to go down. Therefore when after conducting the experiment my hypothesis was proved because the first heart rate reading was the highest. It was the highest the first time because they were anticipating it more therefore they were nervous. Since they had already done their blood pressure before it was a breeze because they had nothing to worry about. Some possible errors were not placing the cuff on the right area of the arm. We had to take her blood pressure quite a few times because it wasn't reading it correctly. Another source of error might have been not getting the correct count on the blood pressure. This is why we checked the blood pressure twice one manually and one on the automatic blood pressure reader.
This activity illustrates the various components used to assess cardiovascular fitness, including pulse rate, blood pressure, endurance and the baroreceptor reflex.
Hypothesis:
If you take the blood pressure of the subject three times then the subjects first reading of their blood pressure will be the highest. When conducting the experiment we are:
- Using a sphygmomanometer to obtain a blood pressure reading.
- Measure blood pressure and pulse rates at rest and following exercise.
- Assess the relative cardiovascular fitness of an individual.
Materials:
- Stethoscope
- Sphygmomanometer
- Rubbing Alcohol
- Paper Towels
- Automatic Blood Pressure
Steps in Conducting Activity 10A:
- One lab partner sit relaxed on a chair, roll up the sleeves of shirt on left arm if needed.
- The other lab partner-recorder fasten the sphygmomanometer on the subjects left arm above the elbow.
- Clean stethoscope before using it with rubbing alcohol on a piece of paper towel.
- 1. Close valve of the sphygmomanometer by turning clockwise until it is tight
5. 1. inflate the sphygmomanometer cuff by pumping until it reads at least 200 mm Hg.
2. The open valve on sphygmomanometer slightly so the air from the cuff escapes slowly.
3.Recorder should then listen carefully watching the pressure gauge to determine the pressure where the sound of a Korotkoff are first noticed-Systolic Pressure.
6. Continue to release pressure from cuff slowly and pay attention to gauge, once you hear the heart sound stop this is the diastolic pressure.
7. The recorder should then release the rest of the air and take off the cuff of the test subject and record the systolic and diastolic pressure and record them in data table 1.
8. Take 2 more readings of the subject and record them in Data Table 1.
9. Repeat for other lab partners so you have gotten 3 readings for each person.
Conclusion: Since we had to take the blood pressure of the subject 3 times the blood pressure did go down. The first reading of the blood pressure was the highest then it started to go down. Therefore when after conducting the experiment my hypothesis was proved because the first heart rate reading was the highest. It was the highest the first time because they were anticipating it more therefore they were nervous. Since they had already done their blood pressure before it was a breeze because they had nothing to worry about. Some possible errors were not placing the cuff on the right area of the arm. We had to take her blood pressure quite a few times because it wasn't reading it correctly. Another source of error might have been not getting the correct count on the blood pressure. This is why we checked the blood pressure twice one manually and one on the automatic blood pressure reader.
Activity 10B: Fitness Test
Hypothesis: If the subject doesn't remain calm and quiet while laying down then they will get a bad blood pressure reading.
Materials:
Steps in Conducting Activity 10B:
Hypothesis: If the subject doesn't remain calm and quiet while laying down then they will get a bad blood pressure reading.
Materials:
- Sphygmomanometer
- Stethoscope
- Rubbing Alcohol
- Paper Towels
- Stopwatch
- steady chair to be able to step up and down on
Steps in Conducting Activity 10B:
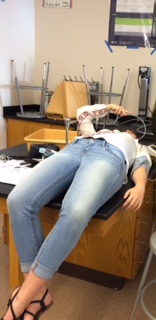
- Lie flat on a lab table for 5 minutes wearing a sphygmomanometer on their arm. They should remain calm and quiet during this time.
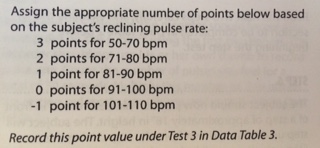
- At the end of 5 minutes locate the subject's pulse on their wrist with two fingers. Count the number of pulses you feel for a total of 30 seconds. Then multiply the count by 2 to get the the resting pulse rate per minute and record it in Data Table 2.
- Clean the stethoscope's earpieces and takes the subject's blood pressure while the subject is still lying on the bench. Record this in Data Table 2.
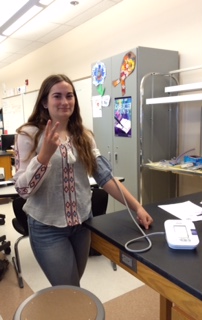
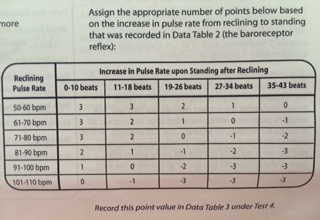
- Lay on the bench for 2 more minutes, then stand up. immediately take the blood pressure and pulse immediately when they stand. Other group members should assist with this. Record the blood pressure and pulse rate values in Data Table 2.
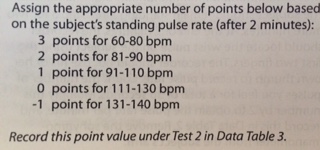
- The subject should remain standing for 2 more minutes. Then record pulse rate and record it in Data Table 2.
- Remove the sphygmomanometer from the subjects arm.
- Now have the subject do the step test by step on to the step with one foot, then the other then step down. Have them repeat this 5 times.
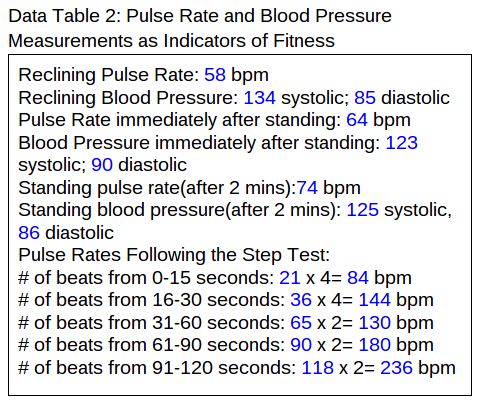
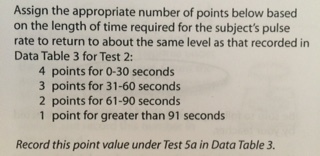
- After the subject finishes the test the recorder will begin taking the subjects pulse rate. You have to record it after 15 seconds, 30 seconds, 60 seconds, 90 seconds, 120 seconds without stopping in between. To record the data at the correct time the recorder will call out the pulse rate at the given times. The other group member will be recording them in Data Table 2.
 |  |
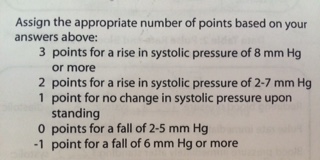
Calculating the FItness Score:
Calculate the difference between the standing and the reclining systolic blood pressures. 11 mm Hg
Systolic Pressure: Rise or Fall? Fall
Calculate the difference between the standing and the reclining systolic blood pressures. 11 mm Hg
Systolic Pressure: Rise or Fall? Fall
Conclusion:
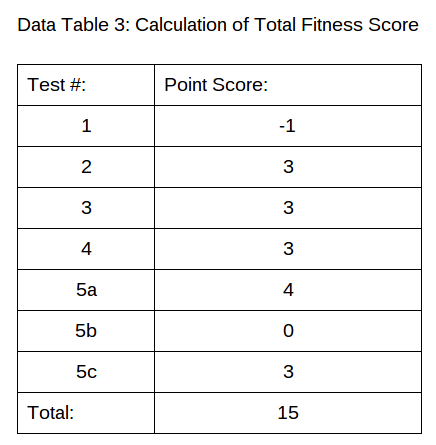
According to the index of cardiac fitness our test subject (Alyssa) has a good fitness score of 15. When we were measuring her blood pressure it took quite a long period of time. One of our sources of errors was when Alyssa was laying down she did not remain quiet and silent. She was talking which probably through off her difference between standing and reclining blood pressure. Therefore we had bad pulse rates and blood pressure readings in the beginning of the experiment due to the subject not remaining calm and quiet. As soon as the timer went off we had to immediately take her pulse rate then her blood pressure. As soon as she stood up we had to take her pulse rate and blood pressure too.
Some other sources of error could have been not giving yourself enough time to conduct the experiment, not taking the subject's pulse rate and blood pressure right away and not having the subject change their breathing for their fitness test. One huge source of error could have been not remaining calm and quiet while we took each other's blood pressure.
Activity 10C:The Influence of Temperature on Heart Rate
Hypothesis:
If you increase the temperature of the water then the Daphnia's heart rate will go up.
When conducting the experiment we will:
Steps in conducting Activity 10C:
Hypothesis:
If you increase the temperature of the water then the Daphnia's heart rate will go up.
When conducting the experiment we will:
- Observe the effect of temperature change on the heart rate of an invertebrate.
- Graph the relationship between heart rate and temperature in an invertebrate.
- Daphnia
- 1 mL Pipet
- Deep Well Slide
- Dish with room temperature water
- Dish with 10℃ water
- Dissecting Microscope
- Thermometer
Steps in conducting Activity 10C:
- Cut the tip off of the plastic 1 mL pipet so that the opening is large enough to draw in one Daphnia.
- Draw up the Daphnia and place it into the well side of the deep well slide with 2 drops of culture fluid.
- place the cover on the slide, examine the daphnia under the microscope.
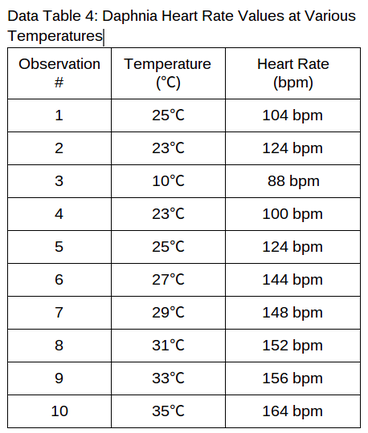
- Count the number of heartbeats you observe in 15 seconds. Multiply it by 4 to get the beats per minute. Record the number in Data Table 4.
- Use the thermometer to get the temperature of the culture fluid. Record the temperature in Data Table 4.
- Submerge the deep well slide of Daphnia in a petri dish containing 10℃ water. Observe the Daphnia's heart rate for 15 seconds. Multiply the number by 4 to get the beats per minute. Record the amount in Data Table 4.
- Use the thermometer to get the temperature of the water around the slide and record it in Data Table 4.
- Pour warm water into the dish, for every increase of 2℃ record the Daphnia's heart rate for 15 seconds, then convert it to bpm and record it in Data Table 4.
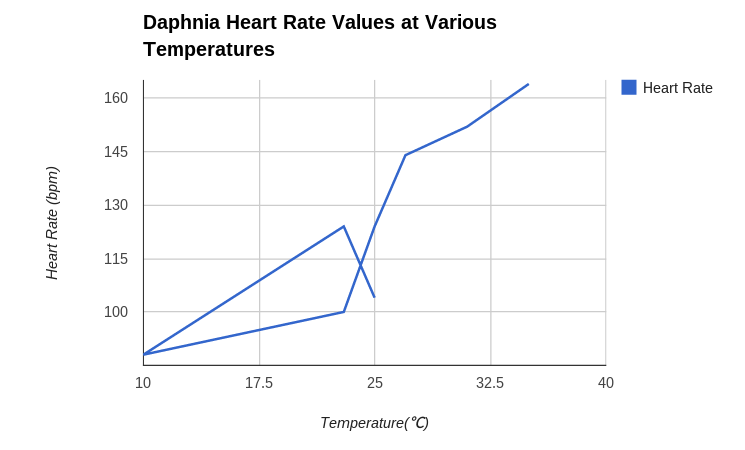
Graph Justification: When creating a graph for the Daphnia I needed one that would prove a change in temperature at different heart rates which means a change over time. Therefore I chose a line graph because it allowed me to create a graph that proved my data.
Conclusion: During this experiment we can see that there was a huge plunge in the Daphnia's heart rate when we moved the Daphnia from room temperature water to ice cold water. Once the temperature increased so did the Daphnia's heart rate. Therefore our hypothesis was correct because when there was an increase of temperature there was an increase in their heart rate. Some sources of errors that could have taken place was that if the daphnia died before conducting the experiment, also if the water was not war enough or the water temperature didn't change at all. Another source of error could have been not giving yourself enough time to conduct the experiment.
Conclusion: During this experiment we can see that there was a huge plunge in the Daphnia's heart rate when we moved the Daphnia from room temperature water to ice cold water. Once the temperature increased so did the Daphnia's heart rate. Therefore our hypothesis was correct because when there was an increase of temperature there was an increase in their heart rate. Some sources of errors that could have taken place was that if the daphnia died before conducting the experiment, also if the water was not war enough or the water temperature didn't change at all. Another source of error could have been not giving yourself enough time to conduct the experiment.
Answers for questions for 10A-10C:
- Some possible damaging effects on the body due to chronic hypertension might be cardio vascular damage and it makes your body grow weaker.
- Blood pressure is normally lower when a person is reclining than standing because when you are standing you are moving around which is making your blood circulate more frequently but when you are laying down you are not moving which means the blood pumps slower in the body because it doesn't needed to be circulated more often because you aren't doing anything.
- The baroreceptor reflex is one of the body's homeostatic mechanisms that helps maintain blood pressure at nearly constant levels. It is important because it keeps everything balanced in the body.
- The blood vessels get smaller in diameter due to cold temperatures because they don't want to lose any heat. They constrict to avoid heat loss in the vessel.
- If an ectotherm is hot it will find shade under a tree to regulate its body temperature from being too hot. If the ectotherm is too cold then it will lay under the sun on the ground or rocks to raise their body temperature due to the the warmness of the sun and ground/rock.
- Ectotherms take their body temperature from the environment around them which means if the temperature decreases them the metabolic rate decreases. Endotherms are warm blooded and don't take their body temperature from things around them which means the environment wouldn't mess with its metabolic rate.
 RSS Feed
